Field Experiences in Battery Internal Resistance and Capacity Testing
This research article issued by DV Power shows some field experiences with internal resistance tests and capacity testing. In addition, it provides a comparison between these two tests. The conclusion discusses some merits and short comings of each test.
Abstract
In order to remain reliable, stationary batteries require maintenance and care over their service life. A large number of tests have been performed and described in order to determine the condition of the battery. Capacity tests are used to reliably determine battery capacity. The results of capacity tests are then used to evaluate whether the battery can continue in service or needs to be replaced. Many batteries do not receive regular capacity testing due to several myths and misunderstandings, also the measurement of battery resistance is becoming a popular alternative test method. Both tests are useful in detecting deteriorated cells, however there are some initiatives to replace capacity testing with internal resistance testing. This paper shows some field experiences with internal resistance tests and capacity testing. In addition, it provides a comparison between these two tests. The conclusion discusses some merits and short comings of each test.
Introduction
Battery internal resistance has been a huge topic among battery users and battery manufacturers. In recent years there has been considerable activity and comments in the use of internal resistance measurements for the assessment of the state of health of batteries.
The main reason for this is that many battery users perceive capacity testing as both complicated and expensive. The goal is to find an alternative test method in order to replace battery capacity testing.
The available techniques are AC impedance and conductance methods as well as DC loading, which measures some form of a cell’s internal resistance.
As a battery cell ages and loses capacity, its vital components (plates, grids, and connection straps) undergo unavoidable degradation. Internal resistance measurements are intended to measure this change in resistance. Measured increase in resistance indicates likely degradation and a corresponding loss of capacity.
| Factor | Internal cell resistance | Effect on capacity | Comments |
| Grid corrosion | Increase | Decrease | Natural aging process. |
| Grid swelling and expansion | Increase | Decrease | Loss of contact between active material and grid. |
| Loss of active material | Increase | Decrease | Active material sheds from plates, forming sediment. |
| Discharge | Increase | Decrease | Either self-discharge or load discharge. |
| Sulfation | Increase | Decrease | Attributable to undercharging |
| Internal short circuits | Possible decrease followed by an increase | Decrease | Internal short circuits can cause resistance to decrease. If resistance subsequently increases this may cause self-discharge, which will cause the voltage to fall. |
| Temperature decrease | Increase | Decrease | Low temperature degrades the cell chemical reaction, slows the chemical process, and limits available capacity. |
| Temperature increase | Decrease | Increase | High temperatures accelerate the cell chemical reaction, shorten the cell life, and increase the available capacity. |
| Rated cell capacity | Decrease | Increase | Resistance tends to decrease as cell size increases. |
A number of factors affect the internal resistance and capacity of a cell simultaneously. However, not all factors affect a cells capacity to the same degree as they affect internal resistance and vice-versa. In this project, both internal resistance measurements and capacity tests were taken on a periodic basis. The measurements were then compared in order to determine the relationship between capacity and internal resistance measurements.
Method description
DV Power has developed several models of battery load banks used for capacity testing, as well as a device for internal resistance testing. These units were used all over the world in cooperation with our customers and results were obtained in order to evaluate the relationship between internal resistance measurements and battery capacity, as well as to check the viability of using internal resistance as an indicator of cell and battery capacity. Batteries in this paper are used in electric utility applications. Some interesting examples are shown in the table 2.
| Battery Type | Nominal capacity | Discharge current | C – rate | Internal resistance |
| VRLA – TPL 121000 – 12V 100 AH | 85 Ah | 28,7 A | C3 | Approx. 3.70 mΩ |
| Pure Lead – NSB 60FT HT RED | 51/52 Ah | 17 A | C3 | 4.3 mΩ @ 25°C (77°F) |
| VRLA (AGM) – CT200-12 | 149 Ah | 49 A | C3 | Approx. 3.0 mΩ |
The first step was to perform an internal resistance test in order to check for suspicious results and increased resistances in the battery string. After that the capacity test was performed and the results were compared.
Test equipment
The following test equipment was used to measure the internal resistance and capacity of stationary battery cells:
- DV Power Battery Load Unit BLU200A – capacity tester
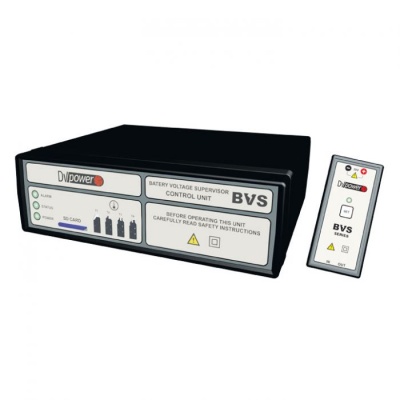
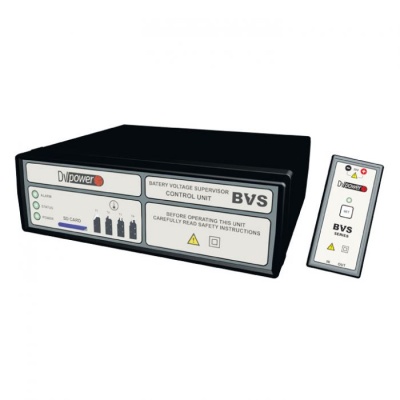
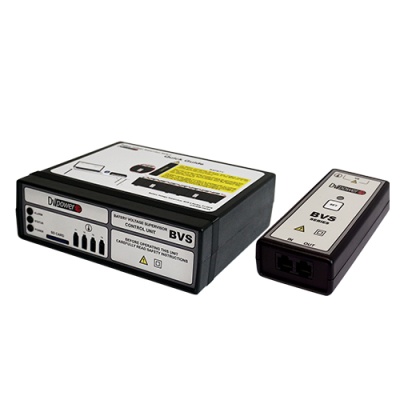
- Battery Voltage Supervisor BVS – cell voltage monitoring system
- Fluke BT521 – resistance tester
- DV Power IBAR – Battery Resistance Tester
Results
Internal resistance measurements were taken before a battery capacity test. During the capacity test voltage of each cell was measured and capacity was calculated upon completion of the test. Then internal resistance measurements were compared to the individual cell capacities to determine the trend performance. For older batteries that are ready to be replaced or should be replaced, internal resistance measurements can identify low capacity cells in a battery string, however resistance data cannot always be directly correlated to a capacity test, because there are many variables at work during a discharge that may influence the test results.
It is possible that a battery with internal resistance reading which is high in comparison to others in a string will maintain an acceptable voltage longer during a discharge than other batteries in the string with comparatively lower resistance readings. Figures below show some test results of a batteries where the capacity and internal resistance do not match.
In Figure 1 we can see that cells 5, 7 and 14 had higher resistances like cells 7 and 2, however its voltage was within the limits at the end of the capacity test.
On the graphs shown in the Figure 2 we can see the match between internal resistance and capacity results. Cell 1 and 8 high internal resistance results. That degradation was confirmed after capacity testing.
In Figure 3 it can also be seen that we do not have perfect match. After internal resistance measurement the condition of the cell 5 was considered as acceptable, however after the capacity testing the cell voltage dropped.
All of the above graphs show that the internal resistance test and the capacity test will not always have the same conclusion.
This can be caused by any of the following factors:
- A poorly executed resistance test on a battery. This can be caused by poor connection with the lead post material due to the presence of steel connection hardware or other impediments.
- An occurrence where other stronger batteries within the string fully support the discharge load, in essence compensating for the degraded battery (this can be identified with a higher resistance measurement). This can cause a false sense of security with the string as on a subsequent discharge this anomaly may not occur, and the load may be left at risk.
- Erratic measurements due to an abnormally high level of AC current (ripple current) from the DC charging system, often caused by a malfunctioning charging system. To counteract this situation, the batteries can be tested off-line.
- Inter-cell connection integrity: It is critical for system performance that the inter-cell connectors are properly torqued. IEEE maintenance practices require that connection torque levels are checked and recorded as loose connections will alter discharge performance.
Conditions that should be considered as indication for immediate replacement
Internal Resistance Test
- A battery that has an increase in its resistance by 40% or more of its rated internal resistance as established for that specific battery in that specific site.
- A battery that while on float charge exhibits a voltage reading that varies by more than 5% of the manufacturer’s specification for float voltage.
- If either of the above two conditions exist, it is possible that the battery string will give satisfactory operation if called into service, providing the condition exists in only one or two of batteries in the string, as other known good batteries in this string will overcompensate for the failing batteries. However, this may reduce the long-term life of all the batteries.
Capacity Test
- For this test recommended practice is to replace the battery (cell) if its capacity is below 80% of the manufacturer rating.
- A capacity of 80% indicates the battery (cell or string) rate of deterioration is increasing even though there is still a capability to support the load.
- Capacity is usually expressed in ampere – hours (Ah). However at the end of the test it should be always expressed in a percentage of the manufacturer’s published capacity. It can be expressed using following formula:
C – Capacity at a specific temperature recommended by the manufacturer.
Ta – Actual time duration of the test until reaching the specified string end voltage
Tm – Manufacturer’s rated time to reach the string end voltage
Kt – Temperature correction factor as per the IEEE standard
Conclusion
According to experience, internal resistance measurements can detect deterioration of a battery. However, internal resistance measurements cannot tell everything regarding the battery capability or condition.
Some points to consider are:
- A huge increase in internal resistance was correlated to a reduction of the cell capacity, which means that low capacity cells can be identified, but absolute predictions regarding the cell capacity are not possible to make. Some cells with bad resistance results were good after capacity test.
- An increase in internal resistance indicates that something inside a cell is changing. However, we often have no way of knowing what degradation has occurred inside the cell. Two different degradation mechanisms might have a similar effect on an internal resistance change but also, they may have a different effect on cell capacity, which means usually there will likely be some degree of data scatter in any correlation between capacity and internal resistance measurements.
- Prior to commencing every internal resistance test there are several initial checks that should be performed in order to increase repeatability and accuracy of results. These include a check on the battery charging current, the measurement of each cell temperature and the setting of appropriate resistance and voltage thresholds in the test device.
- Be certain to make a good connection to the battery on the lead post or copper sleeve with the probes or clamps as appropriate and use this contact point consistently when testing the batteries (if possible, mark the battery where the test contact has been made with a permanent marker for future reference). Stainless steel bolts or connectors will influence test results.
- No known technology can measure exact battery capacity with 100% accuracy with the exception of the full load test. However other techniques can be combined with internal resistance and voltage data to estimate the drop out of batteries under load.
From the above considerations it is clear that each test has its merits, but on balance a capacity test is a more accurate way to determine where the battery is on its predictable life curve.


